

Satellite cloud images · about the last 3 hours
Satellite Images of Clouds over Thailand
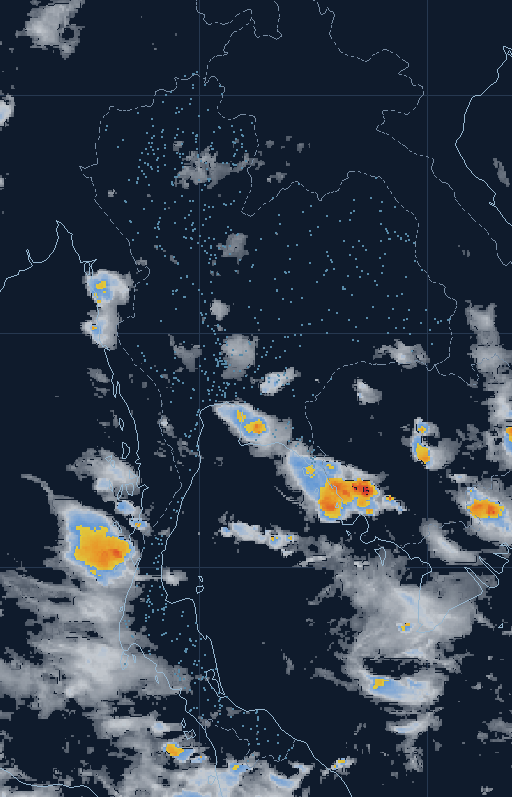
This image shows clouds over Thailand and neighbouring countries seen by a weather satellite in the infrared channel, which measures the heat of cloud tops, so clouds are visible by day and by night. The latest image is from Today 18:50, and the map below lets you play back about the last 3 hours to see where clouds are forming or moving.
Cloud images are not rainfall amounts — use them to spot clouds worth watching, then compare with the measured rain in the regional table below.
Statistics and analysis on this page are for reference only and are not an official warning.
Page views 1 · today 1
Animated clouds on the map
Press play under the map to animate the clouds, or tap a time to see that image · the "Rain" button shows or hides measured rain on top of the clouds
Map © OpenStreetMap
Measured rain right now by region
Rain over the past 24 hours from ground rain gauges · use it alongside the cloud image| Region | Highest measured rain, 24 h (mm) | Rain class | Heavy rain or above / gauges reporting |
|---|---|---|---|
| Southern Region | 197.5 | Extreme | 154 / 1,024 |
| Central Region | 196.5 | Extreme | 70 / 801 |
| Northern Region | 122.5 | Very heavy | 155 / 2,033 |
| Northeast Region | 115.0 | Very heavy | 23 / 705 |
| Bangkok Metropolitan | 70.0 | Heavy | 5 / 13 |
| Myanmar | 0 | No rain | 0 / 3 |
How to read the cloud image
Cloud image colours
- Thin cloudThin mid- to high-level cloud, mostly without rain
- Thick cloudThicker cloud with colder tops; some rain possible
- High topsVery high, very cold tops, often the upper part of rain clouds
- ThunderstormCore of thunderstorm clouds; heavy rain possible
- SevereTops of very severe thunderstorms
The image is coloured by cloud-top temperature: the higher the cloud top, the colder it is. Transparent areas have no cloud, or only low clouds whose tops are almost as warm as the ground. Faint to solid white is mid- to high-level cloud, blue is very high and very cold cloud that is often the top of rain clouds, yellow to orange is the core of thunderstorm clouds, and red to magenta marks cloud tops that have shot up very high, usually in severe thunderstorms.
Cloud does not always mean rain. Some white cloud is thin high cloud that brings no rain, while yellow, orange or red clusters are more likely to bring heavy rain. The rain that actually reaches the ground can be more or less than the colours suggest, so the image tells you where clouds are worth watching, not how many millimetres fell.
An infrared image only sees the heat of whatever is on top. Low clouds with warm tops, fog, or rain from shallow clouds may not appear at all, so some provinces get rain while the image looks clear. The reverse also happens: a wide sheet of white high cloud may have no rain beneath it.
A good way to use it is to play the animation on the map to see which way the clouds are moving, then compare with the measured rain table on this page, or turn on the rain layer to see rain gauges on top of the clouds. If orange or red clusters sit over a region where the table shows heavy rain, rain there may continue. If clouds are moving towards you, check the water level at a station near you as well.
Each image has its time shown under the map in Thailand time. The latest image is a little behind real time because it needs processing before release. If the latest image is too old, this page says there is no recent image instead of showing an old one.
The timeline under the map continues past the real images with a forecast part covering about the next 12 hours, showing the cloud expected hour by hour. It is the same kind of picture as the real cloud images and uses the same colours: white is cloud, blue is high cloud tops, and yellow, orange and red are thunderstorm clouds expected to develop. This part uses a different bar colour from the real images and is marked "Forecast" next to the time. Forecast frames look smoother than the real images because they are a broad estimate, not a photograph. The place and timing of real clouds may differ, and this layer does not show rainfall amounts, so use it for the trend together with the latest real cloud image and the measured rain.
How cloud images differ from rain radar
This site does not show weather radar. The images here come from a satellite looking down from space at cloud tops, while a weather radar stands on the ground and bounces signals off raindrops in the air. Radar therefore shows the position and strength of falling rain more closely, but only within range of each radar station.
A satellite sees clouds across the whole country and the surrounding seas, which suits the big picture, such as a monsoon trough or an approaching storm. To know how much rain actually fell, look at measured rain from rain gauges, which record the rain that reaches the ground.
Rain today nationwide · Dam water levels · Water levels nationwide
FAQ
What time is the latest cloud image on this page?
The latest image is from Today 18:50 (Thailand time). Images are published a little behind real time because they need processing.
Do red or purple clouds mean heavy rain?
Not always. Red to purple means very high and very cold cloud tops, which are common in severe thunderstorms, but the amount of rain on the ground has to be read from rain gauges, such as the measured rain table by region on this page.
Why does it rain in some provinces when no cloud shows in the image?
Because an infrared image only clearly shows cloud tops that are much colder than the ground. Low clouds with warm tops and rain from shallow clouds may not appear in the image.
How far back can I see cloud images?
The map plays back about the last 3 hours. Press play to watch the clouds move, or tap a time under the slider to see the image at that time.
What is the forecast part of the timeline, and how far can I trust it?
It is an hour-by-hour estimate of cloud for about the next 12 hours, drawn with the same colours as the real cloud images, but it is not a real photograph. Use it to see where and when rain clouds are likely to arrive. The further ahead, the less exact it gets, especially for local thunderstorms, and it does not show rainfall amounts, so read it together with the latest real cloud image and the measured rain.